
6. Signal and Noise
AI in Portfolio Management and Trading

This is the sixth installment of my course summaries from teaching AI in Finance at NYU Stern (see lecture slides here and last week’s summary here). This session starts with a topic I’ve been obsessed with for years: is there anything distinguishing behind Jackson Pollock paintings, or are they pure noise?
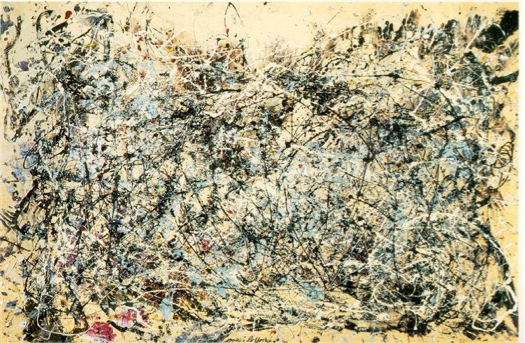
The latest research on this question concludes the answer is yes: there is enough of a personalized signature in Pollock paintings for a machine learning algorithm to distinguish them from forgeries 93% of the time. One particularly distinctive feature is that Pollock’s paintings are self-similar, i.e. they are fractal, in the sense that the whole painting is similar in some sense to small pieces of the painting.
This is the basic premise of AI applied to asset management and trading: that there is enough signal, amidst all the noise, that it’s worth delegating more and more of these “core” financial capital market decisions to machines. To examine how that works, this session asks three questions:
Is there a “scaling law” for alpha the way there is in other LLM applications?
If so, who captures the value?
How do we make sure this alpha is “real” and survives the translation from backtesting to trading, and dealing with adversarial market participants?
Scaling for Trading
Trading in markets involves three parts: first, you estimate expected returns. This can be as simple as an analyst using a multiples based approach to project winners, or in the quant version it involves connected likely future returns to numerical aspects of securities (their “factors” or “characteristics”). Then, when we have some sense of how stocks are likely to do, we run these through some sort of portfolio optimizer to balance the correlations and other risks across this basket of securities. And finally we trade the portfolio. Each of these steps can be augmented with AI, but this brings a host of new challenges as well.
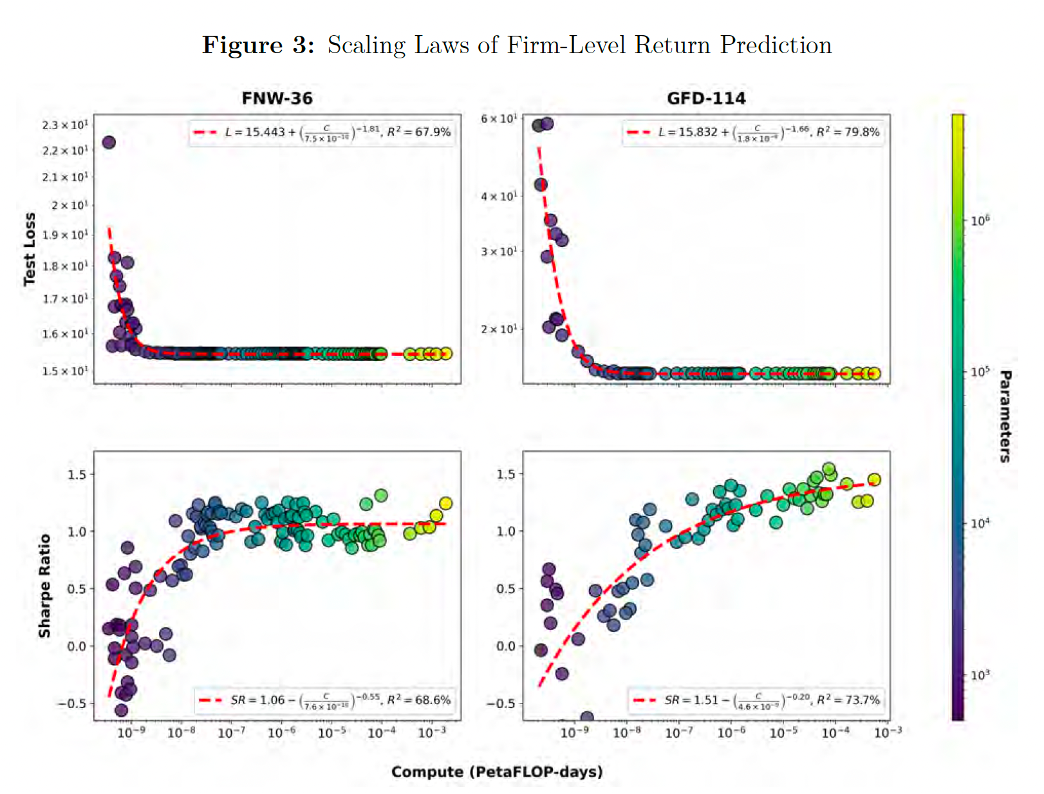
Let’s start with the basic question: does the prediction of excess return scale with better models? The answer, in a great paper by Timmerman and Vulicev, is that return prediction scales with better models much as language does. Forecast performance follows stable power laws in training compute, and 25% increase in compute would have raised an investor’s Sharpe ratio by roughly 10% over the last thirty years. Throwing more and more parameters at the problem of return prediction finds more and more complicated patterns that eke out more gains.
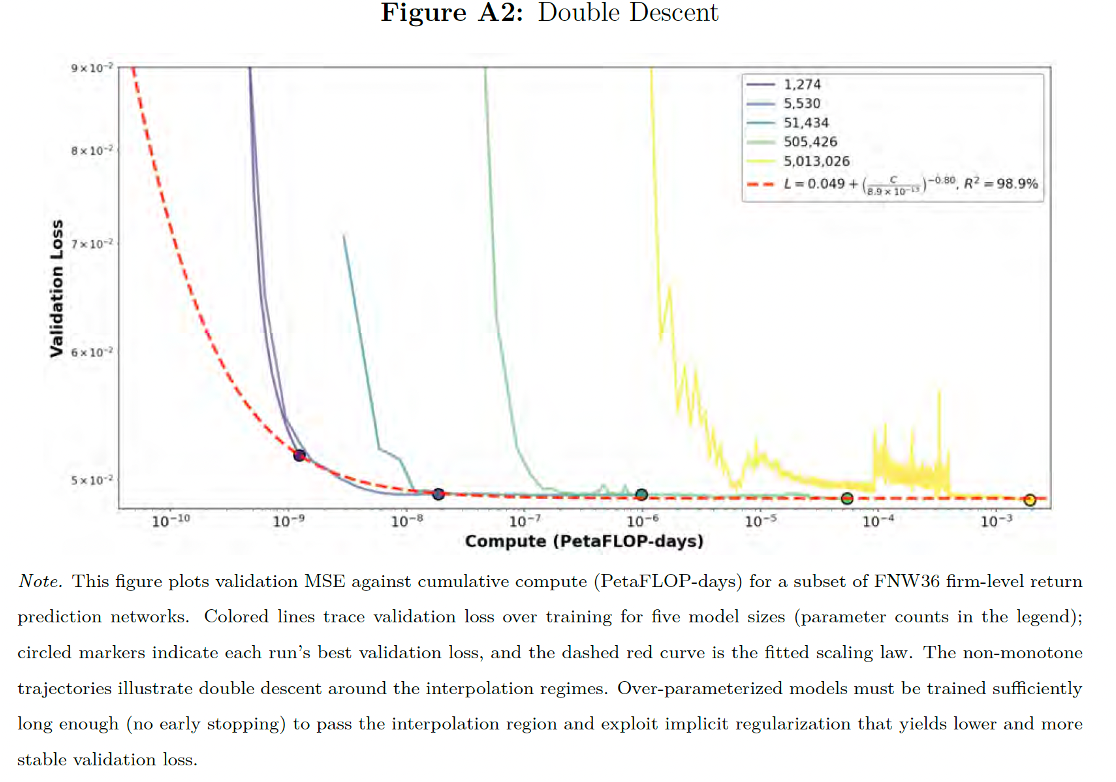
They find a couple of other results worth emphasizing. One is that they validate the concept of double descent in financial contexts. This is a concept we covered in our first session in which model error can get worse as you approach an interpolation point, but then gets better and better as we blow past it. This is completely contrary to standard intuition in classical statistics, as well as standard finance practice; which is that we want to have a relatively small set of robust factors explaining return performance (a one factor model in the CAPM, or maybe a three factor model as in Fama-French).
Even standard machine learning and empirical Bayes methods don’t quite get us all the gains, because through regularization (i.e., setting some variables to zero if they appear noisy) we throw out some valuable signal along with the noise. To really see the gains you need to do the full neural net method of allowing for as many model combinations as possible to massively over-parameterize and train our model. Of course the industry has figured this out, even if it’s new to finance academics: the paper goes through a laundry list of major quant firms bragging about their compute and research datasets.
You may be nodding your head along if you are familiar with AI already in other applications; this is another rehash of the Bitter Lesson we also covered in that first session. But Finance, particularly capital markets trading, is different in ways that makes it harder to capture value through the AI solution.
Most obviously; the combined size of all the quant funds using sophisticated algorithmic strategies is surprisingly small: Renaissance Technology’s Medallion Fund for instance, the paradigmatic example of a sophisticated compute heavy strategy, has roughly $15 billion in assets under management. I’ve written about this elsewhere: this is because of sharply diminishing returns to actually capitalize on the computer edge. As a result, the Medallion Fund is operated on a pretty small scale, and runs it basically exclusively with insider capital to maximize the appropriable returns. Outsiders get access to lower-alpha strategies that run on a much larger scale, and have less alpha, and they are harvested primarily for management fees.
The problem is trading costs and competitors copying your strategy and trading against you adversarially quickly eat the returns from a better strategy. The world is non-stationary, i.e., always changing, so the model has to track a moving target, and distinguish genuine signals from patterns that just fit the training data and fall apart when deployed.
What we are left with is a relatively small number of quant funds heavily competing on compute, which substantially dilutes the profits they can earn. The scarce complements, in this world, are data, infrastructure, and latency, which are able to capitalize on some of the rents.
Taming the Factor Zoo
This issue of data mining has really plagued the whole academic literature on return predictors. Academics have put together over 300 published factors which supposedly predict stock returns, which is the factor zoo problem. Many of these factors, when tested rigorously out of sample, tend to fail. Even when the factors work, it’s unclear how to best combine and trade them.1
The landmark paper here is Gu, Kelly, and Xiu’s “Empirical Asset Pricing via Machine Learning” which compares a range of ML and AI methods in figuring out what combination of factors works best to predict returns. They find, naturally enough, that neural net methods work very well, with out-of-sample R² around 1.8%. Unlike in other domains, they find that a neural net with a relatively small number of layers tends to perform best, which they interpret as a sign that finance is prone to overfitting because of a relatively low signal-to-noise ratio. The right amount of model complexity, however, has increased over time. A fascinating question which no one has tackled yet is what the impact is of more sophisticated trading strategies on the prediction problem itself. Is finance going to get inherently much more complicated as people use more AI to trade?
This group followed that up with another paper “(Re-)Imag(in)ing Price Trends” which is a really crazy paper trying to use AI to resuscitate technical analysis through image analysis of price charts. Though academic finance and many practitioners tend to look down on this kind of chartist analysis, people also do generally believe strategies like momentum and reversal which also rely on trends. The AI here, interestingly enough, seems to find a lot of complex patterns in the charts that go beyond validated signals and seem to transfer across domains, and even time scales. This goes back to the fractal example we started with: financial markets also appear to be somewhat self-similar, in that a model fit on very high-frequency data (which is ideal, since we have a lot of this data) can extrapolate somewhat to say daily or monthly returns.2
Map vs Territory
All of this gets into a map versus territory debate: when is the model giving us a true, but highly complicated, representation of the world, and when is it picking up spurious relationships that only work in-sample? There is an interesting debate here, which I want to highlight to stress how this remains a contentious issue even in frontier research.
On the one hand we have a continuing thread of authors Kelly, Malamud, and Zhou, who argue for the “Virtue of Complexity in Return Prediction.” This argues in a similar vein as earlier that over-parameterized models can outperform in return prediction; where they use Random Fourier Features to blow up the dimensionality of the problem and document better performance (in terms of alpha, Shape ratios, information ratios). Then we have Stefan Nagel who argues against this Seeming Virtuous Complexity. He argues that when you get so many more variables (or “features” in ML-speak), the apparently complicated strategy actually just boils down to a weighted average of recent returns, which is just a volatility-timed momentum strategy. So what seems like a sophisticated new complex strategy is really just a well-known one, and the apparent performance in-sample is sort of a coincidence, rather than a fundamental aspect of the strategy per se.
Novy-Marx and Velikov highlight some of the broader challenges here in a nice paper “AI-Powered (Finance) Scholarship” which gets into the scope for data mining to produce spurious AI-powered results faster than referees can triage them, complete with made up narratives to support the strategy.
This debate will continue on, and the benefits (or lack thereof) of complexity in return prediction don’t hinge on any one paper or method. But this illustrates the challenges of interpretation when the model complexity blows out. If we don’t know what our strategy is really doing, we don’t know what risks we are really taking and what therefore might go wrong as the world changes.
Portfolio Selection
Even if we “solve” the problems above in figuring out what stocks or aspects of stocks meaningfully predict returns, we are then left with the problem of how to best sort these stocks into portfolios. This is the basic Markowitz portfolio problem: with N assets, a bunch of expected returns µ, and the covariance matrix across stocks Σ; we want to find the combination of stocks which minimizes return for a given amount of risk.
The problem here is the Σ. A covariance matrix for N assets has N(N+1)/2 parameters, which is 55 for ten assets, but 125k for the S&P 500, and about 4.5 million for the Russell 3000. Estimating this reliably requires a time series much larger than the number of assets, which we don’t have in monthly data. Michaud pointed out back in 1989 how brittle the mean-variance approach is to any kind of estimation error in this process, which has led to conclusion that it’s vary hard to beat indexing (i.e., 1/N for each asset).
A foundational application of AI here is “Asset Embeddings” by Gabaix, Koijen, Richmond and Yogo. The idea is that rather than estimating all of the pairwise correlations, we do a lower dimensional reduction of securities into an embedding space. The question is what is the natural analogue of relatedness between two stocks (akin to words being sequenced in a sentence), so you can produce something like next-stock-prediction in a series.
The solution they come up with is to look at portfolio holdings. So they mask a position in a portfolio (an example in the paper is to blank out Zoom in ARK’s holdings), and see if the model can recover the holding based on all the other stocks in the portfolio. Repeating this at scale produces a network of securities which seems pretty reasonable (i.e., Apple is “near” Adobe, in the sense that funds tend to co-own them, and Citibank is near other banks and financials), and they do some interesting work using earnings transcripts to isolate some of the narrative factors that seem to drive location in embedding space, and the embeddings themselves explain valuations. This is a very neat and natural application of the embedding methodology to finance, and the narrative or expositional layer also helps us to make sense of the underlying black box.
There are a few other approaches. Zhang, Zohren and Roberts’s “Deep Learning for Portfolio Optimization” skips the return forecasting step entirely to train portfolio weights which maximize Sharp ratios. López de Prado’s “Hierarchical Risk Parity” clusters assets by similarity and allocates risk across and within clusters instead of dealing with the covariance matrix.
Also, I think it’s worth thinking about the economies of scale here, which is Grinold’s fundamental law of active management: the information ratio (additional return per unit of risk) is roughly the information coefficient (correlation between actual and expected return) times the square root of breadth (number of independent bets): IR ≈ IC·√BR. This means that the skill per bet you make matters a lot, but the number of bets also stacks, albeit at a diminishing rate.
This is the basic economic logic I think for the quant shops (Two Sigma, Citadel) as well as the multi-manager pod shops. If you have nine independent signals, but can find a tenth one; you can stack them and earn additional returns uncorrelated with each other. This means that the limits of exploiting any one strategy or niche can be partially addressed by layering unrelated signals, at least up to some point. So we end up with medium-scale economies that account for quant and pod shops not taking over the entire market, but still having some fairly substantial size or AUM.
Transactions Costs
Even if we solve the other problems, we have to then translate an optimal portfolio into trades. Esakia and Goltz look at how all the complexities inherent in ML solutions translate when you incorporate realistic trading costs. They find the value of the nonlinearities in particular seems to go away, while the information breadth advantages seem to persist. To really get the value of the nonlinearities just entails so much trading activity that realistic frictions eat away the true value you can get.
A big lesson here so far is that the zero-sum nature of financial trading places huge limits on the value of AI deployment. It also means the social value gained is also maybe not so large, to the extent AI just fuels competing compute-heavy organizations. So I want to also stress two areas where I think we see more broad based social gains.
First, where AI also seems to be paying off is through augmentation. It’s hard to tell how much of this is marketing copy, but Norway’s Sovereign Wealth Fund reports something like 20% productivity gains through automation of newsflow monitoring, analyzing earnings call transcripts, and trading efficiency gains.
Second, personal wealth management seems like another high elasticity corner of the investing world. One simple example is tax loss harvesting, in which you sell a losing stock to bank a capital loss, and swapping to hold the exposure with another stock that is virtually the same. This strategy has well known alpha; but AI lowers the cost of delivering this and so personalized, tax-aware rebalancing shifts from being an expensive bespoke service to one that is nearly free, and so can scale rapidly across personal accounts.
The Future of Asset Management
So let’s put this all together and think through the equilibrium. As we get better and better prediction engines, the first order thing we expect to happen is that markets get more efficient and alpha is harder to find and sustain. That’s good for passive market investors and hard for discretionary stock pickers.
The quant heavy approach will still reward compute and scale, but the role of adversarial trades leads to a double-edged sword. On the one hand, it means that gains are likely to get sniped and diluted quickly, diminishing alpha further. However, there may be fresh new gains from forecasting the ever-changing strategies of others (one example would be trading around index fund reconstitution. This is an example in which new algorithms, i.e., index fund creation, results in predictable new order flow variation and hence trading opportunities). In the long-run, we expect the gains to accrue to whoever owns the relevant scarce complements to this activity (data, infrastructure, latency, etc.).
So AI will likely continue to shape the market, but it’s going to be very hard to capture the value in doing so. One promising area to try to make that happen is through activities which do new things to try to expand the pie: taking services which used to be costly and reserved for the rich, and finding ways to distribute them at a much broader scale. It’s not enough to figure out whether a painting is recognizably Pollock or not; can we then create a million more examples and place them in the homes of anyone who wants one?
Readings
We have two cases; one on Citi and Aladdin wealth ([1], [2], [3]), and one on iBuyers ([1], [2], [3]).
This relates to the discussion in Discount Rates: I [John Cochrane] tried telling a hedge fund manager, “You don’t have alpha. I can replicate your returns with a value-growth, momentum, currency and term carry, and short-vol strategy.” He said, “‘Exotic beta’ is my alpha. I understand those systematic factors and know how to trade them. You don’t.” He has a point. How many investors have even thought through their exposures to carry trade or short volatility “systematic risks,” let alone actually can program computers to execute such strategies as “passive,” mechanical investments? To an investor who hasn’t heard of it and holds the market index, a new factor is alpha.