Loss for Prediction Markets in the Election
But still some hope for expert information aggregation systems
Two years ago, I wrote about the relative performance of poll aggregation vs prediction markets in forecasting electoral results. The way I think about it now is that there are two important reasons to be excited about the growth of prediction markets:
They have the potential to clean up biases and herd analysis in thinking. One example of this would be whether polls were accurately assessing Republican chances in Midwestern states during the 2020 election. But you could also think about how prediction markets forecast the likelihood of Trump not conceding the election in the aftermath. By putting money on the line and harnessing the wisdom of the crowds, markets provide the incentives and the mechanism to produce reliable signals on real-world events: news you can use.
Prediction markets can clean up punditry. When we talk about politics, electoral speculation, or really anything else — we are often making forecasts about future possibilities. But casual punditry is often reduced to discussing this stuff verbally, without the discipline of a quantitative forecast or accountability for what happened.
What I dreamt of was a world in which people would point to and trade in political contracts the same as they do for stocks. You don’t need to speculate about how Google’s earnings report will impact their earnings — you start by looking at the stock price. And so a rich series of contracts in real world events could provide the Arrow-Debreau basis for our broader conversation: a fundamental shared reality of prices and probabilities to anchor the discussion.
But for this to work, prediction markets need to be accurate in forecasting. Were they this time around?
Midwestern Low Trust Voters
We saw a very specific bias in the elections in 2016, 2018, and 2020: polls failed to pick up a segment of low-trust voters who were particularly inclined to vote for Trump. Challenging for pollsters, these low-trust voters were not defined by their education, or even partisanship. Accounting for highly engaged Democrats, who are more likely to respond to polls, might a bit help with this problem but maybe not fully.
Prediction markets succeeded a bit more than the average of polls because they leaned Republican, particularly in states where we say that persistent polling error. For that matter, even Republican-leaning pollsters like Trafalgar were more accurate for that reason.
The open question in this election is whether that pattern would continue; and how prediction markets would account for it. One possibility, as Nate Cohn suggested, is that the geographical pattern of polling bias might indeed recur, because Democrats were forecast to do well in exactly the same places where polling misses were large earlier. Another possibility, as Nate Silver instead argued, is that polling biases come and go: best to just take the averages and not worry too much about it.
Then there are the questions about how prediction markets did get it right. The best case scenario is that they were aggregating opinions from a broader cross-section of society, and so would pick up the precise amount of bias in polls even as that might change in society. Another possibility is markets are extrapolative: they are just baking in bias from previous elections, but won’t capture changes in reality. And a final possibility is that prediction markets are just Republican-biased, and so got lucky (just like Trafalgar).
What Happened in the Midterms
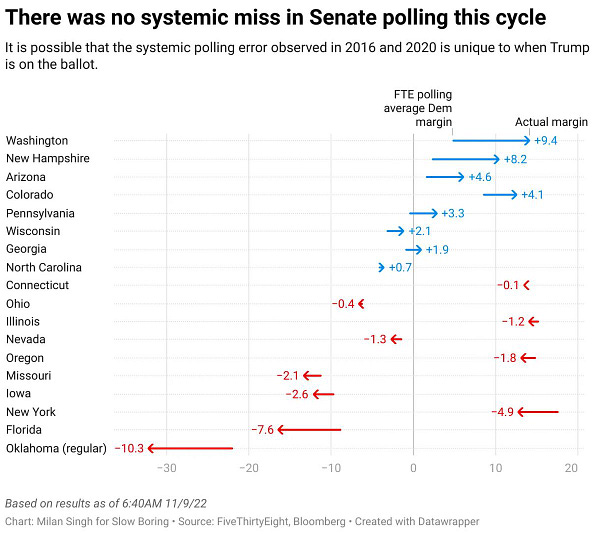
The short answer is that polling biases did not have the same pattern as before — we did not see a systematic bias like in previous cycles. The most likely explanation I think, as Matt Yglesias suggests, is that the “Republican low trust voter” is a Trump-specific problem.


So how did poll aggregators like 538 fare, relative to betting markets? To look at this, I compared 538 estimates for key Senate races (GA, NV, PA, AZ, NH, NC, WI, OH) as well as the prediction for the Senate as a whole. I compared this forecast to the PredictIt prediction market forecasts a day before, two days before the election, as well as a week before. To turn these probabilities into outcomes, I used a Brier score (lower is better).
Now, one thing that’s tricky is figuring out what happened with the Senate overall, as well as with the Georgia race. I’m giving both the Senate and Georgia to Dems based on my assessment of the most likely outcome here, but this doesn’t make a huge difference in the end.
The basic takeaway is that 538 has a lower prediction error compared to PredictIt across all horizons. This is particularly clear when you focus on specific races. PredictIt put a much higher weight on Republicans taking the Senate and Nevada, which do not seem likely at the moment. Both markets and 538 were a bit too favorable to Oz vs Fetterman, though 538 less so (especially compared to the week ahead forecast).
We can also compare the forecast margin of victory for 538 against the actual results. 538 does better here than RCP — which sort of supports the idea that there was a surge in late Republican-leaning polls skewing the RCP average, which 538 saw through a lot better.
On top of the high level miss, there’s also a question about the general volatility about prediction markets. Prediction odds appear to move around a lot, which is hard to square with Bayesian assessments that should feature relatively little belief movement.


Other Approaches Did Even Better
Okay, so case closed, right? Prediction markets appear to have been tilted towards Republicans relative to the 538 average — this helped them in 2018 and 2020, but hurt them in 2022. And there are lots of stories you can come up with: the limits on betting amounts, the potential for market manipulation, a Republican skew in the betting population which might account for that. And, of course, PredictIt is going to shut down soon anyway due to overbearing federal regulation, so you might not get the best participants.
But PredictIt isn’t the only game in town. There are two other interesting platforms out there — Manifold Markets (which is a play money platform), and Metaculus (which is about expert opinion aggregation). The Mataculus estimates come in two variants: one that just averages opinions of all community members, and an “expert” version that weights predictions based on past success to try to get at the superforcasters.
The Manifold market opinion did a little better than 538 overall; but Metaculus did much better. It has by far the lowest Brier score here — correctly calling the Senate, Pennsylvania, and Arizona. The only big “miss” is a relatively high weight on Georgia going to Republicans: but of course this is a genuinely challenging thing to account for (Walker did poll more in the first round, you have the runoffs, etc.).
Takeaway
So one takeaway is that prediction markets aren’t perfect. Of course, the “prediction market vs polls” framing has always been a little off, because of course prediction markets incorporate polling data in their assessments. Still, here we can see that the various problems behavioral economist tell us about can be found in prediction markets too.
I think there is a broader lesson here, though, which is that there is room for many different information aggregation tools to blossom and enrich the public discourse. 538 provides a valuable service, and outperforms a simple polls-only average. Manifold markets did well; and using the wisdom of the crowd approach through Metaculus did really well. I think that opens up the space for us to create new types of information markets, collect and evaluate predictions in different ways — and ultimately start to use this information more in our decision making.
Podcasts
I was on a couple of podcasts lately — Freakonomics and the Bharatvaarta podcast.
Job Market Papers
Lots of interesting job market papers coming out now, a few picks:


India Threads
I do a regular-ish series on news in India, latest thread here:


